Key takeaway: A connection pool is a concurrency limiter, not a capacity buffer. The right size is generally far smaller than intuition suggests.
The Reflex That Backfires
The application logs connection timeouts under load. The pool is set to 20. Someone raises it to 100. Timeouts disappear briefly, then latency degrades across the board and the database starts reporting lock contention.
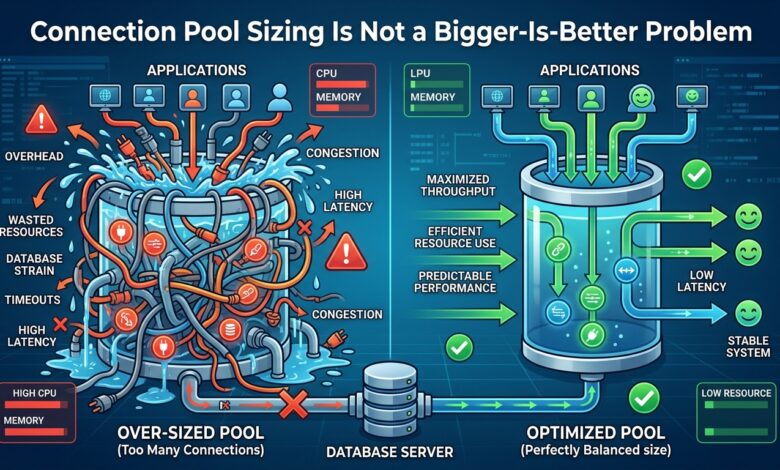
What happened is that the bottleneck was never the pool. The database could productively execute perhaps a dozen concurrent queries given its core count and disk. Raising the pool to 100 did not create capacity — it allowed 100 queries to contend for the same resources, adding context switching, lock waiting and buffer pool thrash.
Queueing did not disappear. It moved from the application, where it was visible and cheap, into the database, where it is expensive and manifests as everything getting slower simultaneously.
Why Small Pools Go Faster
A database server executes queries on a finite number of cores against finite disk parallelism. Beyond that point, additional concurrency adds coordination overhead without adding work completed.
A widely used starting formula for connection count is roughly cores × 2 + effective_spindles. For an eight-core instance with SSD storage that lands around 18 to 20 total connections — across all application instances combined, not per instance.
This is the detail that most often goes wrong. Ten application pods each configured with a pool of 20 present the database with 200 potential connections. The per-pod number looked conservative; the aggregate was four times what the server could use.
| Total pool size | Throughput | p99 latency |
|---|---|---|
| 5 | Under-utilised | Low |
| 20 | Near peak | Low |
| 50 | Slightly below peak | Rising |
| 200 | Well below peak | Severe |
Throughput plateaus and then declines while latency climbs continuously. There is no configuration where 200 connections to an eight-core database outperforms 20.
What To Fix Instead
If a correctly sized pool produces queue waits, the answer lies in reducing time-per-connection rather than adding connections.
Shorten transactions. A transaction holding a connection while calling an external API is the single most common pool exhaustion cause. Do the network call before opening the transaction.
Index the slow queries. A query taking 2 seconds occupies a connection forty times longer than one taking 50 ms. Fixing it multiplies effective pool capacity without changing any configuration.
Separate read traffic. Route reads to replicas with their own pool so analytical queries cannot starve transactional ones.
Add a proxy for high pod counts. PgBouncer or ProxySQL in transaction mode lets many application connections multiplex onto few database connections, which decouples pod scaling from database connection limits.
Diagnosis Before Tuning
Compare two numbers: time spent waiting to acquire a connection, and time spent executing once acquired. High acquisition wait with fast execution means the pool is genuinely too small. High acquisition wait with slow execution means the database is saturated and enlarging the pool will hurt.
The Bottom Line
Compute total connections across every application instance, keep the aggregate near the database’s actual concurrency capacity, and treat pool exhaustion as a signal to shorten queries and transactions rather than to raise the ceiling.